Showing posts with label northwind. Show all posts

5/16/2018

OVP List Card2 - Condensed & Bar

Now we will add bar chart on list card.

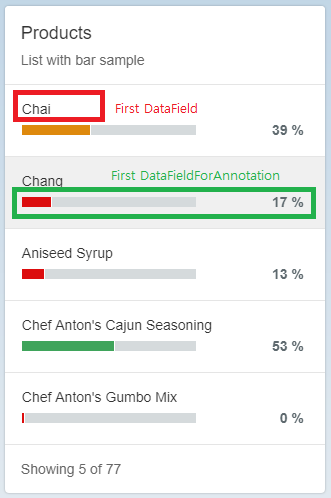
In this blog, we will create List Card like this.


Note. In this example, "UnitInStock" value in Product entity is used to present percentage values. The reason is there is no actual percentage value in Northwind oData services. 


Step 1. Set annotation - Add DataPoint

To show bar chart, we need to prepare DataPoint annotation.

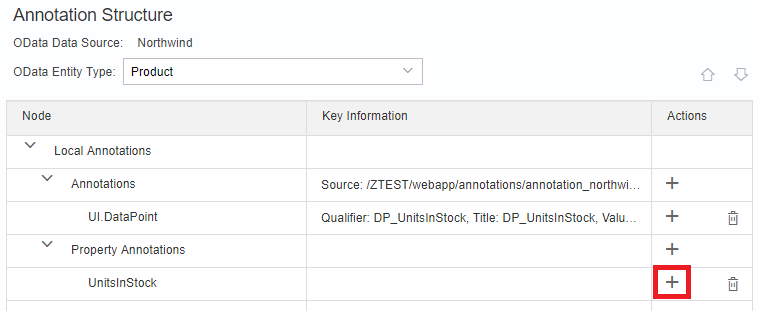
Select "Product" entity type and click "+" button to add DataPoint annotation.


Type in right values for Qualifier and Title, select value as "UnitsInStock". Qualifier should be any unique value for this entity.


Step 2. Set annotation - Set Property Annotation

To display percentage bar chart, we need to set value as percentage type. For this, click "+" button in Property Annotations and find "UnitsInStock".


For "UnitsInStock", click "+" button to add "Unit" property. 


Set unit as "%".


Step 3. Set annotation - Set CriticalityCalculation (bar chart color)

Let's go back to DataPoint we set in step 1. Click "+" button in DataPoint value and add CriticalityCalculation.


To set CriticalityCalculation, set direction first. 

For the direction of "Maximize", 

Chart ColorSymantic NameCondition
GreenGoodvalue >= ToleranceRangeLowValue
YellowCriticalToleranceRangeLowValue > value >= DeviationRangeLowValue
RedErrorDeviationRangeLowValue > value


Create KPIs with data points and criticality calculation in a SAP Fiori Overview Page
https://blogs.sap.com/2018/01/22/create-kpis-with-data-points-and-criticality-calculation-in-a-sap-fiori-overview-page/


Note. For the direction of "Minimize", 


Chart ColorSymantic NameCondition
GreenGoodvalue < DeviationRangeLowValue
YellowCriticalDeviationRangeLowValue <= value < ToleranceRangeLowValue
RedErrorToleranceRangeLowValue <= value


Step 4. Set annotation - Add LineItem

Click "+" button in Annotations and add LineItem.


Click "+" button in LineItem to add DataField.


Set DataField value as "ProductName".


Click "+" button in LineItem to add DataFieldForAnnotation.


Set Annotation as we set in step 1. ("@UI.DataPoint#DP_UnitsInStock")


Step 5. Add Card

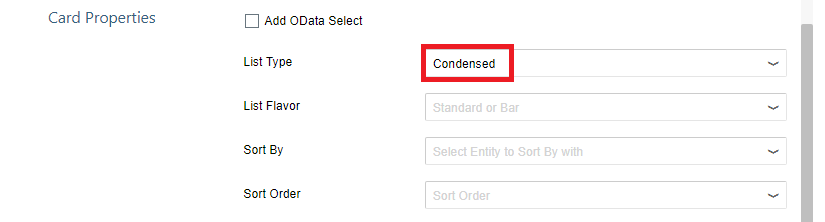
Select List template. And set List Type as "Condensed" and List Flavor as "Bar".


Now it is ready. Rut this as SAP Fiori Launchpad sandbox.


Source Code:


5/14/2018

OVP List Card1 - Condensed & Standard

Let's create List Card.

In this blog, we will create List Card like this.


In this blog, we will create List Card like this.


Step 1. Prerequisites

To create cards in OVP, there are three things to set.

- oData service entity
- annotations
- card type (or templates) and configurations

For connecting oData services, it was handled in previous posts.
It is assumed that NorthWind oData source is connected.


Step 2. Add Annotation File

Annotations are the settings that related to the way how to represent oData.
Depending on the OVP projects, we may need multiple annotation files.
So it is recommended to create the folder for annotation files. (webapp/annotations)

And let's create annotation file


Set annotation file name and select oData Service.


Annotation file for Northwind oData service is created.


Step 3. Open Annotation File to Set

In this example, "Customers" entity will be used.
Select "Customer" entity type and click "+" button to add LineItem annotation.


LineItem annotation is added. Click "+" button to add data fields.


For first data field, set value as "ContactName".


Add two more data field and set Values as "CompanyName" and "Phone" in order.


Step 4. Add Cards

Add cards.


Set datasource.


Select list type template.


Set entity set, title and subtitle.


(Optional) Set List Type as "Condensed". (if it is not set, default setting is "Condensed".)


Now it is ready. Rut this as SAP Fiori Launchpad sandbox.


Source Code:


5/09/2018

Creating a Fiori Overview Page (OVP) with the Northwind OData service


In previous post, oData server is set. 

Then we'll create Fiori OVP project from template.


Step 1. Run WebIDE & login

http://localhost:8080/webide/index.html


Step 2. Create Project from Template

Click Workspace > Right Click > New > Project from Template


Step 3. Create Project from Template

Select Category : All categories

Find "Overview Page Applications"


Step 4. Set Project Name


Step 5. Select Data Service

Sources : Service URL

System : NorthWind

Service : /V2/Northwind/Northwind.svc

Click "Test"


Step 6. Customize template


Step 7. OVP project is created


Step 8. Run as SAP Fiori Launchpad Sandbox


Step 9. Empty OVP


References

Overview Pages
https://help.sap.com/viewer/468a97775123488ab3345a0c48cadd8f/7.52.2/en-US/c64ef8c6c65d4effbfd512e9c9aa5044.html

OVP List Card2 - Condensed & Bar

Now we will add bar chart on list card. In this blog, we will create List Card like this. Note. In this example, "UnitIn...