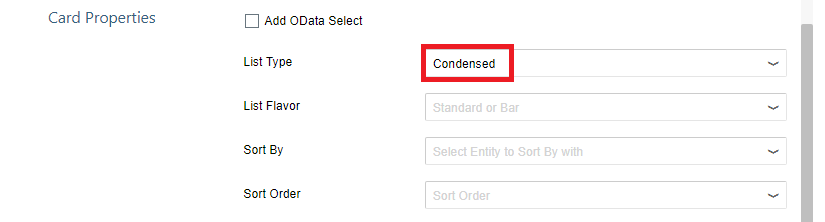
Now we will add bar chart on list card.
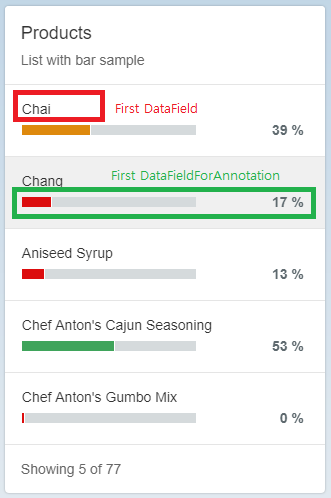
In this blog, we will create List Card like this.

Note. In this example, "UnitInStock" value in Product entity is used to present percentage values. The reason is there is no actual percentage value in Northwind oData services.
Step 1. Set annotation - Add DataPoint
To show bar chart, we need to prepare DataPoint annotation.
Select "Product" entity type and click "+" button to add DataPoint annotation.


Type in right values for Qualifier and Title, select value as "UnitsInStock". Qualifier should be any unique value for this entity.

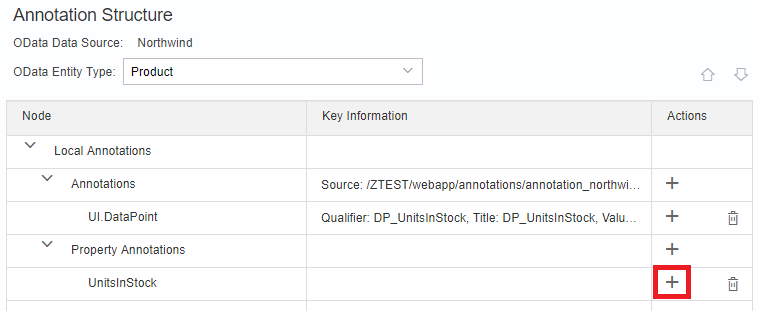
Step 2. Set annotation - Set Property Annotation
To display percentage bar chart, we need to set value as percentage type. For this, click "+" button in Property Annotations and find "UnitsInStock".


For "UnitsInStock", click "+" button to add "Unit" property.

Set unit as "%".

Step 3. Set annotation - Set CriticalityCalculation (bar chart color)
Let's go back to DataPoint we set in step 1. Click "+" button in DataPoint value and add CriticalityCalculation.

To set CriticalityCalculation, set direction first.
For the direction of "Maximize",
| Chart Color | Symantic Name | Condition |
|---|---|---|
| Green | Good | value >= ToleranceRangeLowValue |
| Yellow | Critical | ToleranceRangeLowValue > value >= DeviationRangeLowValue |
| Red | Error | DeviationRangeLowValue > value |

Create KPIs with data points and criticality calculation in a SAP Fiori Overview Page
https://blogs.sap.com/2018/01/22/create-kpis-with-data-points-and-criticality-calculation-in-a-sap-fiori-overview-page/
Note. For the direction of "Minimize",
| Chart Color | Symantic Name | Condition |
|---|---|---|
| Green | Good | value < DeviationRangeLowValue |
| Yellow | Critical | DeviationRangeLowValue <= value < ToleranceRangeLowValue |
| Red | Error | ToleranceRangeLowValue <= value |
Step 4. Set annotation - Add LineItem
Click "+" button in Annotations and add LineItem.


Click "+" button in LineItem to add DataField.


Click "+" button in LineItem to add DataFieldForAnnotation.

Set Annotation as we set in step 1. ("@UI.DataPoint#DP_UnitsInStock")

Step 5. Add Card


Now it is ready. Rut this as SAP Fiori Launchpad sandbox.
Source Code: